
I had the amazing opportunity of conducting a workshop on Aframe (WebVR) at Alva’s College of Engineering, in Mangalore (a city about 350 km from Bangalore) on October 28th 2017. The participation was quite overwhelming (over 70 students attended the workshop). I spoke about Mozilla’s goals in general and about the importance of WebVR in the future. This was followed by introduction to open source philosophy. I then covered up the basics of HTML, CSS and javascript to get them started. This was followed by the Aframe hands-on. We concluded the day long workshop with the students trying out A-frame projects on themes of their choice. Students from all four years of engineering and different branches turned up. I had the opportunity of interacting with the HODs of the Computer Science department at the College. The co-ordinators Prarthana and Trupti were extremely helpful and the college has a great campus and I was overwhelmed by their hospitality. This being the first ever Mozilla event at their college, I look forward to a lot many other events happening at this college as a part of the Moz-Activate initiative.
WebVR Camp Tumkur – MozActivate
I recently had the amazing opportunity of conducting a WebVR workshop on Mozilla’s Aframe library along with fellow Mozillians from Bangalore, Abraar and Mohammed at Siddanganga Insitute of Technology, Tumkur. Around 90 students from different streams and years (majority sophomores) attended the workshop, which was held on October 7th.
The agenda of the camp was to get the students familiar with Mozilla’s ideologies and to spread awareness regarding MozActivate. This was followed by an introduction to FOSS and the importance of contributing to open source in general. We then introduced the concept of WebVR to the students and explained how revolutionary and powerful Aframe is for developing VR applications on the web.
Subsequently, we introduced them to basics of HTML, CSS and Javascript. This was then followed by a detailed hands-on workshop on Aframe. We circulated VR headsets among the crowd to view the projects they make on the fly. In the end, we asked them to develop a project on their own.
The crowd was extremely enthusiastic and curious to learn and we received a very good response. We’ve been able to achieve 90+ projects on Aframe with this camp. We’ll be giving out Moz Swag (T-shirt) and the head-set to some of the most creative projects and also distribute the swag among the students.
Special thanks to Prabodh Sir, COSMOS club at SIT and Abhiram for co-ordinating, without whom this workshop wouldn’t have been possible.
Post 4: The Frontend Phase
I shall be elaborating on the Frontend of the project in this post, now that we have the backend rolling (a little bit of testing remains, though). For the backend, I embedded an altogether new function “getReportsForSubprocesses” that takes in a memory reporter callback pointer and calculates the RSS and USS for the content processes. In order to integrate it with the frontend, so that the table in the GUI for about:performance populates and updates itself with these reports, we need to modify the Javascript and xhtml files for about:performance to include the required functionality.
For this, we introduced a new object called “SubProcessMonitor” in the javascript that primarily does two important things:
Number 1 : It gets a handle over nsIMemoryReporter.cpp and calls our newly defined “getReportsForSubprocesses” function by passing in a callback function as argument. The callback function gets converted to a nsIMemoryReporter Callback pointer and XPCOM takes care of this. We have a “getReports” function inside SubProcessMonitor that returns the resultant values calculated by the backend function in the form of a javascript object. We’ve used a map data structure object for this javascript object called “result”, with the key for the map being the “pid” of the process and the description of the callback (“RSS/USS”) for populating the table .
Number 2: It updates the table as defined by a unique identifier in the xhtml file using an “updateTable” function inside SubProcessMonitor. This function does the important job of adding a row to the table for every new pid that it encounters in the “results” object returned by “getReports”. It then populates this row with the corresponding memory values. It also updates the table regularly.
The “go()” function called in the body of aboutperformance.xhtml and defined in the javascript file does the job of loading all the components, when the user loads the about:performance page in the browser. We call the initialization function of the SubProcessMonitor function described above in “go”, so that it further calls “getReports” and “updateTable” to keep updating the Subprocess-performance table.
Once we have the table updating successfully, we’ll be styling it using CSS and this would have our tool all ready!
Post 3: Backend Design
For the Backend phase of the project, we’ll be changing the nSIMemoryReporterManager interface and its implementation for the Linux Operating System, so that memory reports for Content Processes can also be fetched.
I shall be outlining the steps that I’ll be using for the backend in this post. Before that, a bit about Memory Reporting and Memory Reporter Managers:
We intend to periodically report the Resident Set Size (RSS), which is the portion of memory occupied by a process that resides in the RAM. It is the number of pages the process has in real memory. This is just the pages which count toward text, data, or stack space. This does not include pages which have not been demand-loaded in, or which are swapped out. The other important metric that we’d measure is the Unique Set Size (USS), which is the unshared memory of the process, that is guaranteed to be held private to the process. These measurements for RSS and USS need to be made for all content processes through a ‘Callback reporting’ function.
The ‘Memory Reporters’ do the job of measuring the ‘amount’ of memory used by the processes. It is possible to either have a ‘Traversal- based’ reporter that traverses one or more data structures and measures the size of all the allocated blocks in the data structure or a ‘Counter-based’ reporter that maintains a counter that is incremented on each relevant allocation and decremented on each relevant de-allocation. The ‘tree-traversal’ based approach is used here.
Each reporter reports something specific – for example, how much memory is being consumed by graphics things, versus WebGL things versus JavaScript things, etc. These leaves are then summed up to report on the total memory usage. We need to modify nsIMemoryReporterManager, and ensure that the process of getting the memory statistics is light-weight enough that we can do it every few seconds without incurring much overhead. We need to make sure that we aren’t measuring anything twice, lest we may land up into weird results. The chances of double-measuring any parameter are extremely less when using a tree data structure and a traversal-based approach. We can ‘register’ a MemoryReporter object around the piece of code whose memory we wish to measure or monitor and ‘unregister’ it (this is extremely important in order to avoid memory leaks) when we are done with the measurements. For iterating through the Content Parent, we use ‘weak pointers’ as we pass a raw reference to nsMemoryReporterManager, which
means that other pointers to that instance might go out of scope and then the nsIMemoryReporter will be deallocated, despite nsMemoryReporterManager still having a pointer to it. This not so smart ‘weak’ pointer does not keep the nsIMemoryReporter’s alive, hence we need to ‘unregister’ on completion.
In our case, we have a pretty simple hierarchy: Just the parent and the content processes. The children report back to the parent processes using the ‘callback’ method.
Let’s take a look at the callback function, which takes in several values, including:
- a path (which identifies the report);
- an amount
- a unit (most commonly bytes, but sometimes a unitless count or percentage);
- a description of what is measured.
void callback(
in ACString process,
in AUTF8String path,
in PRInt32 kind,
in PRInt32 units,
in PRInt64 amount,
in AUTF8String description,
in nsISupports closure
);
We’ll be adding an extra ‘getReportsForSubprocesses’ method, which should take a
nsIMemoryReporterCallback function and would iterate through all content processes, gathering the USS and RSS metrics for each one by querying the OS, and then calling the nsIMemoryReporterCallback with the values it has gathered for RSS and USS. The pid() accessors help us iterate through the Content Parent.
We shall be using ‘GetResidentUnique’ (USS) and ‘GetResident’ (RSS) system calls on each of the content processes, which would then trigger ‘ResidentUniqueDistinguishedAmount’ and ‘ResidentDistinguishedAmount’ OS calls for calculating USS and RSS respectively.
At the heart of these calculations, lie the /proc/[pid]/smaps and /proc/[pid]/statm kernel specific files that are used by the GetProcSelfSmapsPrivate and GetProcSelfStatmField methods for calculating RSS and USS. These are the last and the most important functions that are called in stack by the above mentioned OS calls. The ‘amount’ returned is in bytes, which is calculated after calculating the number of pages and the page size.
Here’s a brief peek into what and how the OS does to get these metrics, something I learnt from the Linux Man Pages on kernel specific calls: The OS first inspects /proc/[pid]/smaps and /proc/[pid]/statm to get an idea of the memory footprint of the process. After clearing the ‘Referenced’ and ‘ACCESSED/YOUNG’ bits and, after waiting for some measured time interval, it once again inspects the values to get an idea of the change in the memory footprint of the process during the measured interval.
This week is very exciting and challenging as I’m getting to work on the tricky part of the implementation and getting to learn a lot as the backend unfolds. Feel free to comment or question!
MozLondon 2016! :)

This June, I had the incredible privilege of attending Mozilla’s bi-annual (work week) meet-up, which was held at London. With more than 1350 Mozillians from all over the world, including over 150 volunteers and 64 interns, London All Hands 2016 was the perfect prolific week for all projects across Mozilla, where teams could meet in person and work on their future design. It began with the plenary session, opened by none other than Doctor Who followed by outstanding talks by Chris Beard and Mitchell Baker. The week followed with team-specific meet-ups and brainstorming of ideas, where every attendee could delve in and have their say. I had the pleasure of attending some amazing talks on Rust, Gecko and Servo, Google Apps Training, Electrolysis, Context Graph Data and Fireside chats with Chris Beard. With such a lot of interesting and overwhelming talks by the best speakers going on across the three splendid London hotels as venues, meeting a lot of contributors and getting to know about their work was simply inspirational, and this being my first ever conference, my experience was absolutely terrific!

Photos of the entire work week are now available at: https://www.flickr.com/photos/mozillaallhands/sets/72157669425118160/
Post 2 – The Prototyping Phase
This is my second blog post in the Outreachy series, in which I’ll be elaborating on the UI prototype and a couple of pertinent observations with respect to aboutperformance, that could help in speeding up Firefox.
We’ve come up with a prototype of the UI tool for memory performance measurement of content-processes, taking inspiration from aboutSupport for styling. The table here approximately reflects the memory information that the user would be viewing, which is the per-process RSS (Resident Set Size) and USS (Unique Set Size) usage. These statistics keep updating periodically. This is an extension to the aboutperformance code.
PROTOTYPE
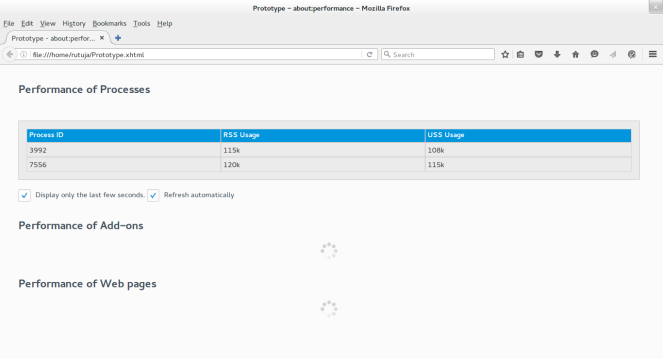
An interesting and crucial observation with respect to speed that we’ve made is that about:Performance (used for calculating the performance of web-pages and add-ons) slows down Firefox. One of the major reasons why this happens is ‘polling’. The about:performance code relies on PerformanceStats that gives it a snapshot of the current values of jank, cpow and ticks, which are compared against the previous values of these variables. The difference or the ‘delta’ of these values is then compared against a threshold for good or average performance. Since the algorithm involved in these computations is complex and the delta is calculated by polling very frequently, it is suspected that this could be one of the reasons why Firefox is slowing down. Here, the PerformanceWatcher code comes to our rescue. This uses an event-based model, wherein an alert notification is passed whenever a web-page or an add-on slows down. This saves a lot of computational overhead as there is no polling and active listeners do the work of reporting to the parent process, in the event when the performance of the child falls below a certain threshold.
To sum it up, about:performance takes snapshots of the entire state of Firefox and computes the difference between trees of snapshots and then uses it to rebuild most of the DOM. Now that we have PerformanceWatcher.jsm, we could redesign the flow to only update when a page/add-on is starting to cause jank/has stopped causing jank. This should be much more efficient, both in terms of DOM and in terms of statistics, as there is no polling or explicit delta calculations taking place. I’ll soon be posting in my next blog about the re-designing of about:performance using PerformanceWatcher and the improvements that we get using with this approach, as against the delta-polling approach based on PerforamanceStats.
Outreachy 2016 – My first post!
I am a dual degree M.Sc.(Hons. ) Mathematics and B.E.(Hons.) Computer Science undergraduate at Birla Institute of Technology and Science (BITS) Pilani K.K. Birla Goa Campus based in Goa, India. I shall be working on Mozilla’s ‘Content Process Management Tool’ project this summer along with my mentor Mike Conley. This is one of the fifteen projects Mozilla is floating for this round of Outreachy (Open Source Program for Women). I shall be writing a series of blog posts on a regular basis on my work on this project.
In my very first post, I would like to share my experience while applying for Outreachy. These internships were inspired in many ways by Google Summer of Code and by how few women applied for it in the past, given the low number of women participating in the FOSS development. These internships were started to improve and encourage women’s participation in such projects. I applied for the organization ‘Mozilla’.
The Mozillian community is extremely supportive and welcoming towards new contributors.I started working on my initial contribution, which was a UI mock-up wireframe for the tool along with two memory-related bug fixes.
The project is about building a Content Process Management tool that can track real-time memory usage across each process, focussing mainly on memory management. The broad aim of this is to help scale up and tune the number of content processes that Firefox starts and uses, keeping memory in mind. Once the basic version of this management tool is ready, we can further increase the number of uses of this tool over time.
After many constructive reviews and suggestions from my mentor, here’s the prototype of the tool that I came up with:
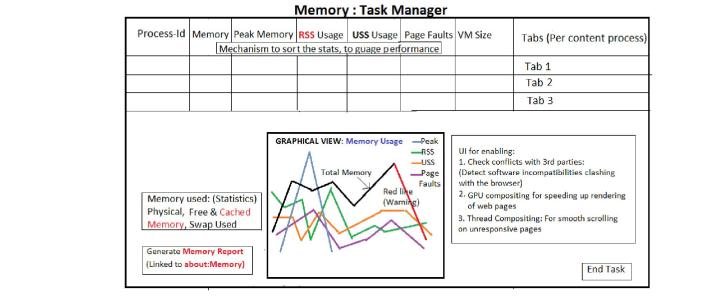
Given full control of the Firefox UI, this is how the tool would look like on opening it from the browser. Since it majorly focuses on Memory (RSS and USS) measurements as the project mainly aims at memory management, there is a mechanism of linking it to about:memory available as well. It gives detailed statistics of Process-Id, RSS, USS, Peak Memory, Virtual Memory usage and Page Faults per tab. Physical, free, cached and swapped memory statistics are also available. The user can sort these statistics and even check for software incompatibilities with the browser. There is also a graphical view of these statistics available, that gives the user a very clear picture.
I began my work a couple of weeks before the application deadline and continued working on it after that as well. I got to learn a lot from the entire process, right from setting up the build environment of Firefox using mercurial, reading up exhaustively on Task Managers and how they work, understanding the about:memory and nsIMemoryInterfaces code from the code base to coming up with a patch (UI wireframe mock-up, link attached below) to getting it reviewed in detail from the mentor and bug-tracking it on Bugzilla. Building and testing patches using Firefox Nightly, which uses the latest code in mozilla-central, updated every 24 hours is the best any contributor can ask for. I feel that Mozilla has a very clean and neat way of reporting bugs, coming up with patches, discussing them on Bugzilla and including them in the source tree after thorough reviews. It has been a great experience so far.
To all the aspiring Outreachy participants, I would encourage you to explore the world of FOSS Projects, hang out on IRC channels and feel free to ask questions. Try finding out the kind of work that interests you the most and keep contributing.
I shall shortly be writing my next post in this series! Questions and comments are welcome! 🙂
